Grafana Loki | Grafana Labs を試しに使ってみました。リソースなどの情報と紐づける形でログの確認ができるようになるのがメリットと聞き、どの程度のものかを確認してみました。
Grafana Loki はReleases · grafana/loki · GitHub からダウンロードします。
以下のようにしてインストールします。
1
2
3
4
5
6
$ curl -O -L "https://github.com/grafana/loki/releases/download/v1.6.0/loki-linux-amd64.zip"
# extract the binary
$ unzip "loki-linux-amd64.zip"
# make sure it is executable
$ chmod a+x "loki-linux-amd64"
$ sudo mv loki-linux-amd64 /opt/loki/loki
ダウンロード後は、/opt/loki/配下に格納することとします。
以下のような設定ファイルを/opt/loki/loki-local-config.yamlとして保存します:
 1
 2
 3
 4
 5
 6
 7
 8
 9
10
11
12
13
14
15
16
17
18
19
20
21
22
23
24
25
26
27
28
29
30
31
32
33
34
35
36
37
38
39
40
41
42
43
44
45
auth_enabled : false
server :
http_listen_port : 3100
ingester :
lifecycler :
address : 127.0.0.1
ring :
kvstore :
store : inmemory
replication_factor : 1
final_sleep : 0s
chunk_idle_period : 5m
chunk_retain_period : 30s
max_transfer_retries : 0
schema_config :
configs :
- from : 2018-04-15
store : boltdb
object_store : filesystem
schema : v11
index :
prefix : index_
period : 168h
storage_config :
boltdb :
directory : /tmp/loki/index
filesystem :
directory : /tmp/loki/chunks
limits_config :
enforce_metric_name : false
reject_old_samples : true
reject_old_samples_max_age : 168h
chunk_store_config :
max_look_back_period : 0s
table_manager :
retention_deletes_enabled : false
retention_period : 0s
とりあえず構築 CentOS7 de Grafana Loki v1.5.0 - Qiita を参考にして、以下のような設定ファイルを/lib/systemd/system/loki.serviceとして保存します:
 1
 2
 3
 4
 5
 6
 7
 8
 9
10
11
12
[Unit]
description = Grafana Loki
Documentation = https://github.com/grafana/loki
After = network-online.target
[Service]
User = root
Restart = always
ExecStart = /opt/loki/loki --config.file=/opt/loki/loki-local-config.yaml
[Install]
WantedBy = multi-user.target
格納後、以下のコマンドを実行し、自動実行します:
1
2
3
$ sudo systemctl daemon-reload
$ sudo systemctl enable loki.service
$ sudo systemctl start loki.service
Loki関連のログを/var/log/loki.logに出力するようrsyslogの設定を行います。以下を/etc/rsyslog.d/30-loki.confとして保存します:
1
2
3
4
5
6
7
# Log kernel generated UFW log messages to file
:syslogtag,contains,"loki" /var/log/loki.log

# Uncomment the following to stop logging anything that matches the last rule.
# Doing this will stop logging kernel generated UFW log messages to the file
# normally containing kern.* messages (eg, /var/log/kern.log)
#& stop
保存後、以下のコマンドを実行し、設定を反映させます:
1
$ sudo systemctl restart rsyslog.service
Promtail はLokiにログを送信するコンポーネントになります。こちらも試しに利用してみます。対象のログは/var/log/loki.logです。
以下のような形でインストールします:
1
2
3
4
$ wget https://github.com/grafana/loki/releases/download/v1.6.0/promtail-linux-amd64.zip
$ unzip promtail-linux-amd64.zip
$ chmod a+x promtail-linux-amd64
$ sudo mv promtail-linux-amd64 /usr/local/bin/promtail
以下のような設定ファイルを作成して、ひとまず/opt/loki/promtail-local-config.yamlとして保存することにしてみます:
 1
 2
 3
 4
 5
 6
 7
 8
 9
10
11
12
13
14
15
16
17
18
19
20
21
22
23
24
25
26
27
28
29
30
31
32
33
34
server :
http_listen_port : 9080
grpc_listen_port : 0
positions :
filename : /tmp/positions.yaml
clients :
- url : http://localhost:3100/loki/api/v1/push
scrape_configs :
- job_name : loki
static_configs :
- targets :
- localhost
labels :
job : loki
__path__ : /var/log/loki.log
pipeline_stages :
- match :
selector : '{job="loki"}'
stages :
- regex :
expression : "^[A-Za-z]+ [0-9]+ [0-9]+:[0-9]+:[0-9]+ (?P<hostname>[^ ]+) loki[^:]+: level=(?P<severity>[^ ]+) ts=(?P<timestamp>[^ ]+) (?P<message>.*)$"
- labels :
hostname : hostname
level : severity
- timestamp :
source : timestamp
format : 2006-01-02T15:04:05.999999999Z
location : Etc/GMT
- output :
source : message
以下のコマンドを実行し、promtailを実行します:
1
$ promtail --config.file= promtail-local-config.yaml
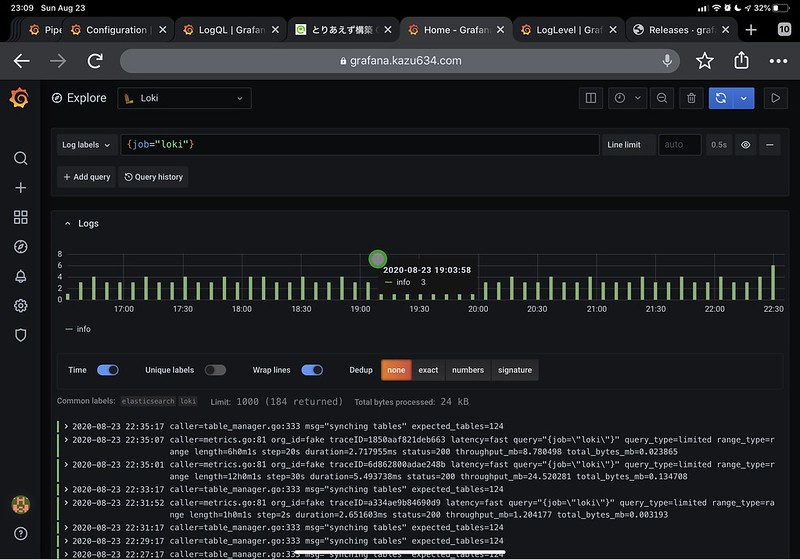
Grafana側でLokiをデータソースにして試しに、{job="loki"}を指定して、以下のように表示されれば問題なく動作しています:
うまく動かない時は以下を試してみます。
Lokiにログを送信せずに、動作確認するためのオプションです:
1
$ promtail --config.file= promtail-local-config.yaml --dry-run
Pipeline Stageの設定がうまく動いていない時は、ログレベルをdebugにすると有益な情報が表示されます:
1
$ promtail --config.file= promtail-local-config.yaml --dry-run --log.level= debug